Annotating barrier condition in MetaChat
Brief introduction
In MetaChat, barrier conditions define anatomical or structural boundaries that restrict metabolite diffusion and cell–cell communication. Annotating these barriers is an essential step to ensure that inferred communication flows respect realistic tissue morphology. This tutorial introduces how to annotate barrier regions in a spatial dataset.
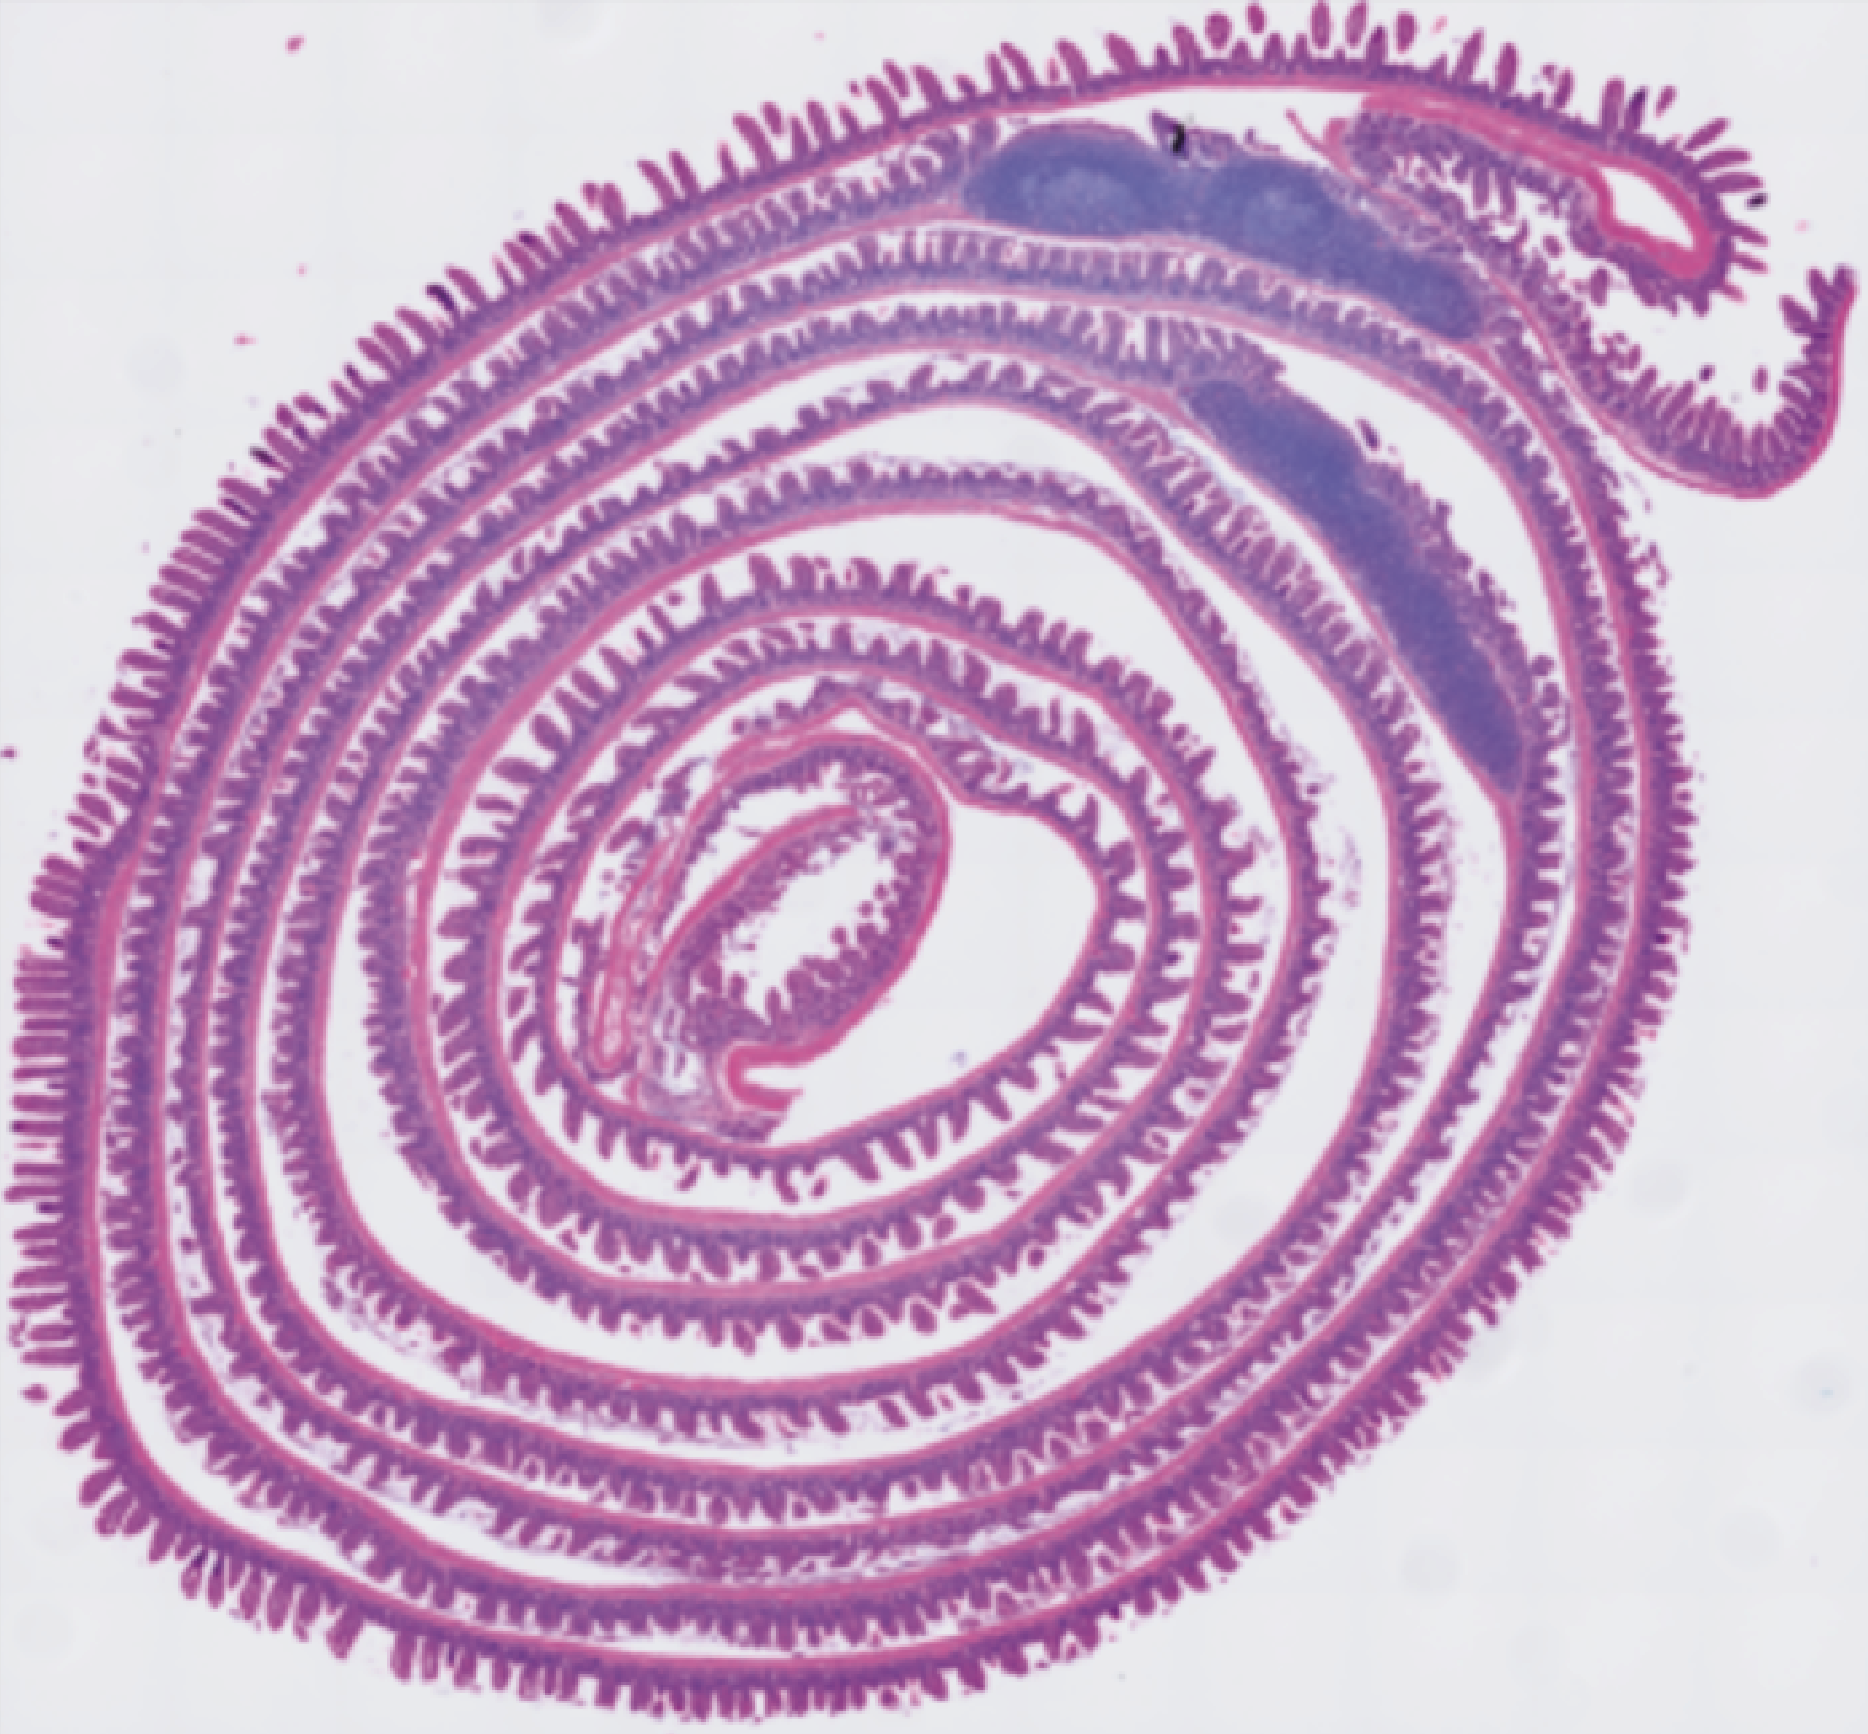
We use the Visium HD dataset of mouse small intestine. In this dataset, the tissue is spirally rolled to fit within the capture area for imaging and sequencing. As a result, regions that are spatially distant in the real anatomy may appear adjacent in the image plane, causing the Euclidean distance in the section to deviate from the true anatomical distance. This makes barrier annotation and distance correction essential for realistic modeling of metabolite transport and communication.
Installation
First, we need to install the squidpy package with Napari by using pip install 'squidpy[interactive]' in your environment.
See also
For basic usage of Napari, please see Squidpy document
Usage
# Importing packages
import os
import metachat as mc
import scanpy as sc
import squidpy as sq
import numpy as np
import pandas as pd
import matplotlib.pyplot as plt
# Setting your work dictionary
os.chdir("/home/project/metachat_packages/")
We can download processed data from Zenodo. For the convenience of presentation, we performed our analysis on a subset of the data.
adata = sc.read('datasets/mouse_small_intestine/adata_combined_subset.h5ad')
image = adata.uns['spatial']['Visium_HD_Mouse_Small_Intestine_lowres_image']['images']['lowres']
img = sq.im.ImageContainer(image,
                           library_id='Visium_HD_Mouse_Small_Intestine_lowres_image',
                           scale=adata.uns['spatial']['Visium_HD_Mouse_Small_Intestine_lowres_image']['scalefactors']['tissue_lowres_scalef'])
Hint
You can check the save information of your images in adata.uns['spatial']. The parameter scale in sq.im.ImageContainer is very important.
Next, please activate interactive interface.
viewer = img.interactive(adata)
/Users/songhao/miniforge3/envs/metachat_test/lib/python3.9/site-packages/squidpy/pl/_interactive/_utils.py:50: FutureWarning: The default of observed=False is deprecated and will be changed to True in a future version of pandas. Pass observed=False to retain current behavior or observed=True to adopt the future default and silence this warning.
  df = df.groupby("clusters")[[0, 1]].apply(lambda g: list(np.median(g.values, axis=0)))
Traceback (most recent call last):
  File "/Users/songhao/miniforge3/envs/metachat_test/lib/python3.9/site-packages/squidpy/pl/_interactive/_widgets.py", line 41, in <lambda>
    self.itemDoubleClicked.connect(lambda item: self._onAction((item.text(),)))
  File "/Users/songhao/miniforge3/envs/metachat_test/lib/python3.9/site-packages/squidpy/pl/_interactive/_widgets.py", line 146, in _onAction
    self._controller.add_points(vec, key=item, layer_name=name)
  File "/Users/songhao/miniforge3/envs/metachat_test/lib/python3.9/site-packages/squidpy/pl/_interactive/_controller.py", line 187, in add_points
    self._hide_points_controls(layer, is_categorical=is_categorical_dtype(vec))
  File "/Users/songhao/miniforge3/envs/metachat_test/lib/python3.9/site-packages/squidpy/pl/_interactive/_controller.py", line 307, in _hide_points_controls
    gl: QGridLayout = points_controls.grid_layout
AttributeError: 'QtPointsControls' object has no attribute 'grid_layout'
AGX: exceeded compiled variants footprint limit
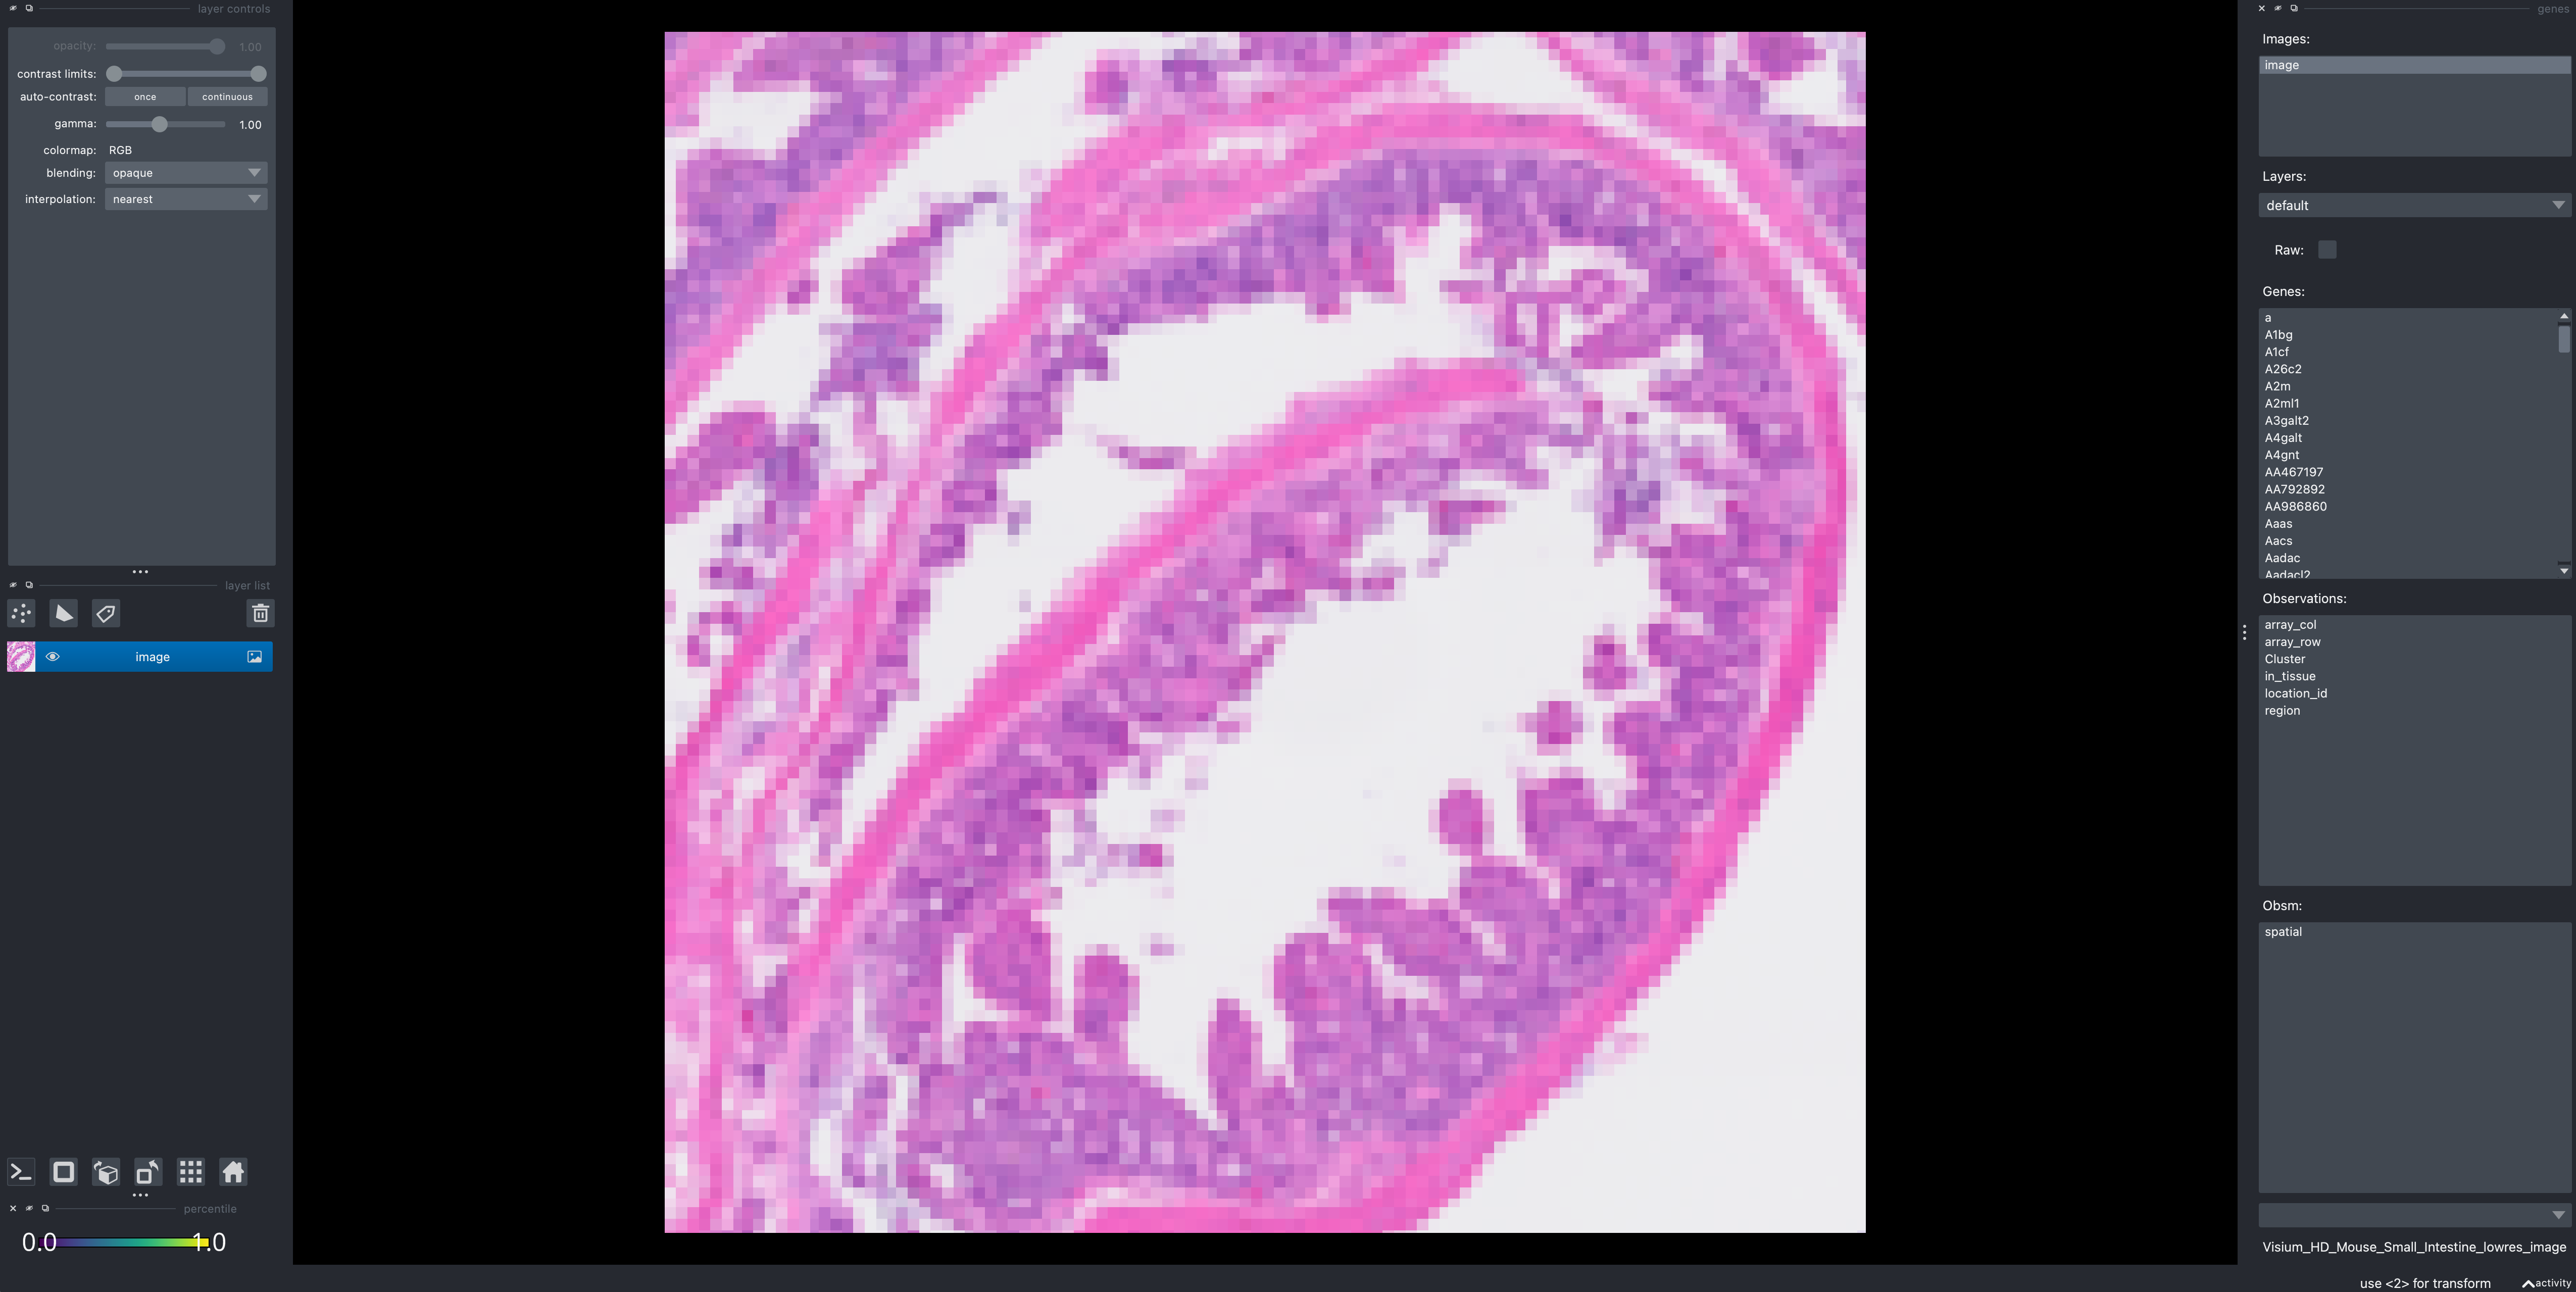
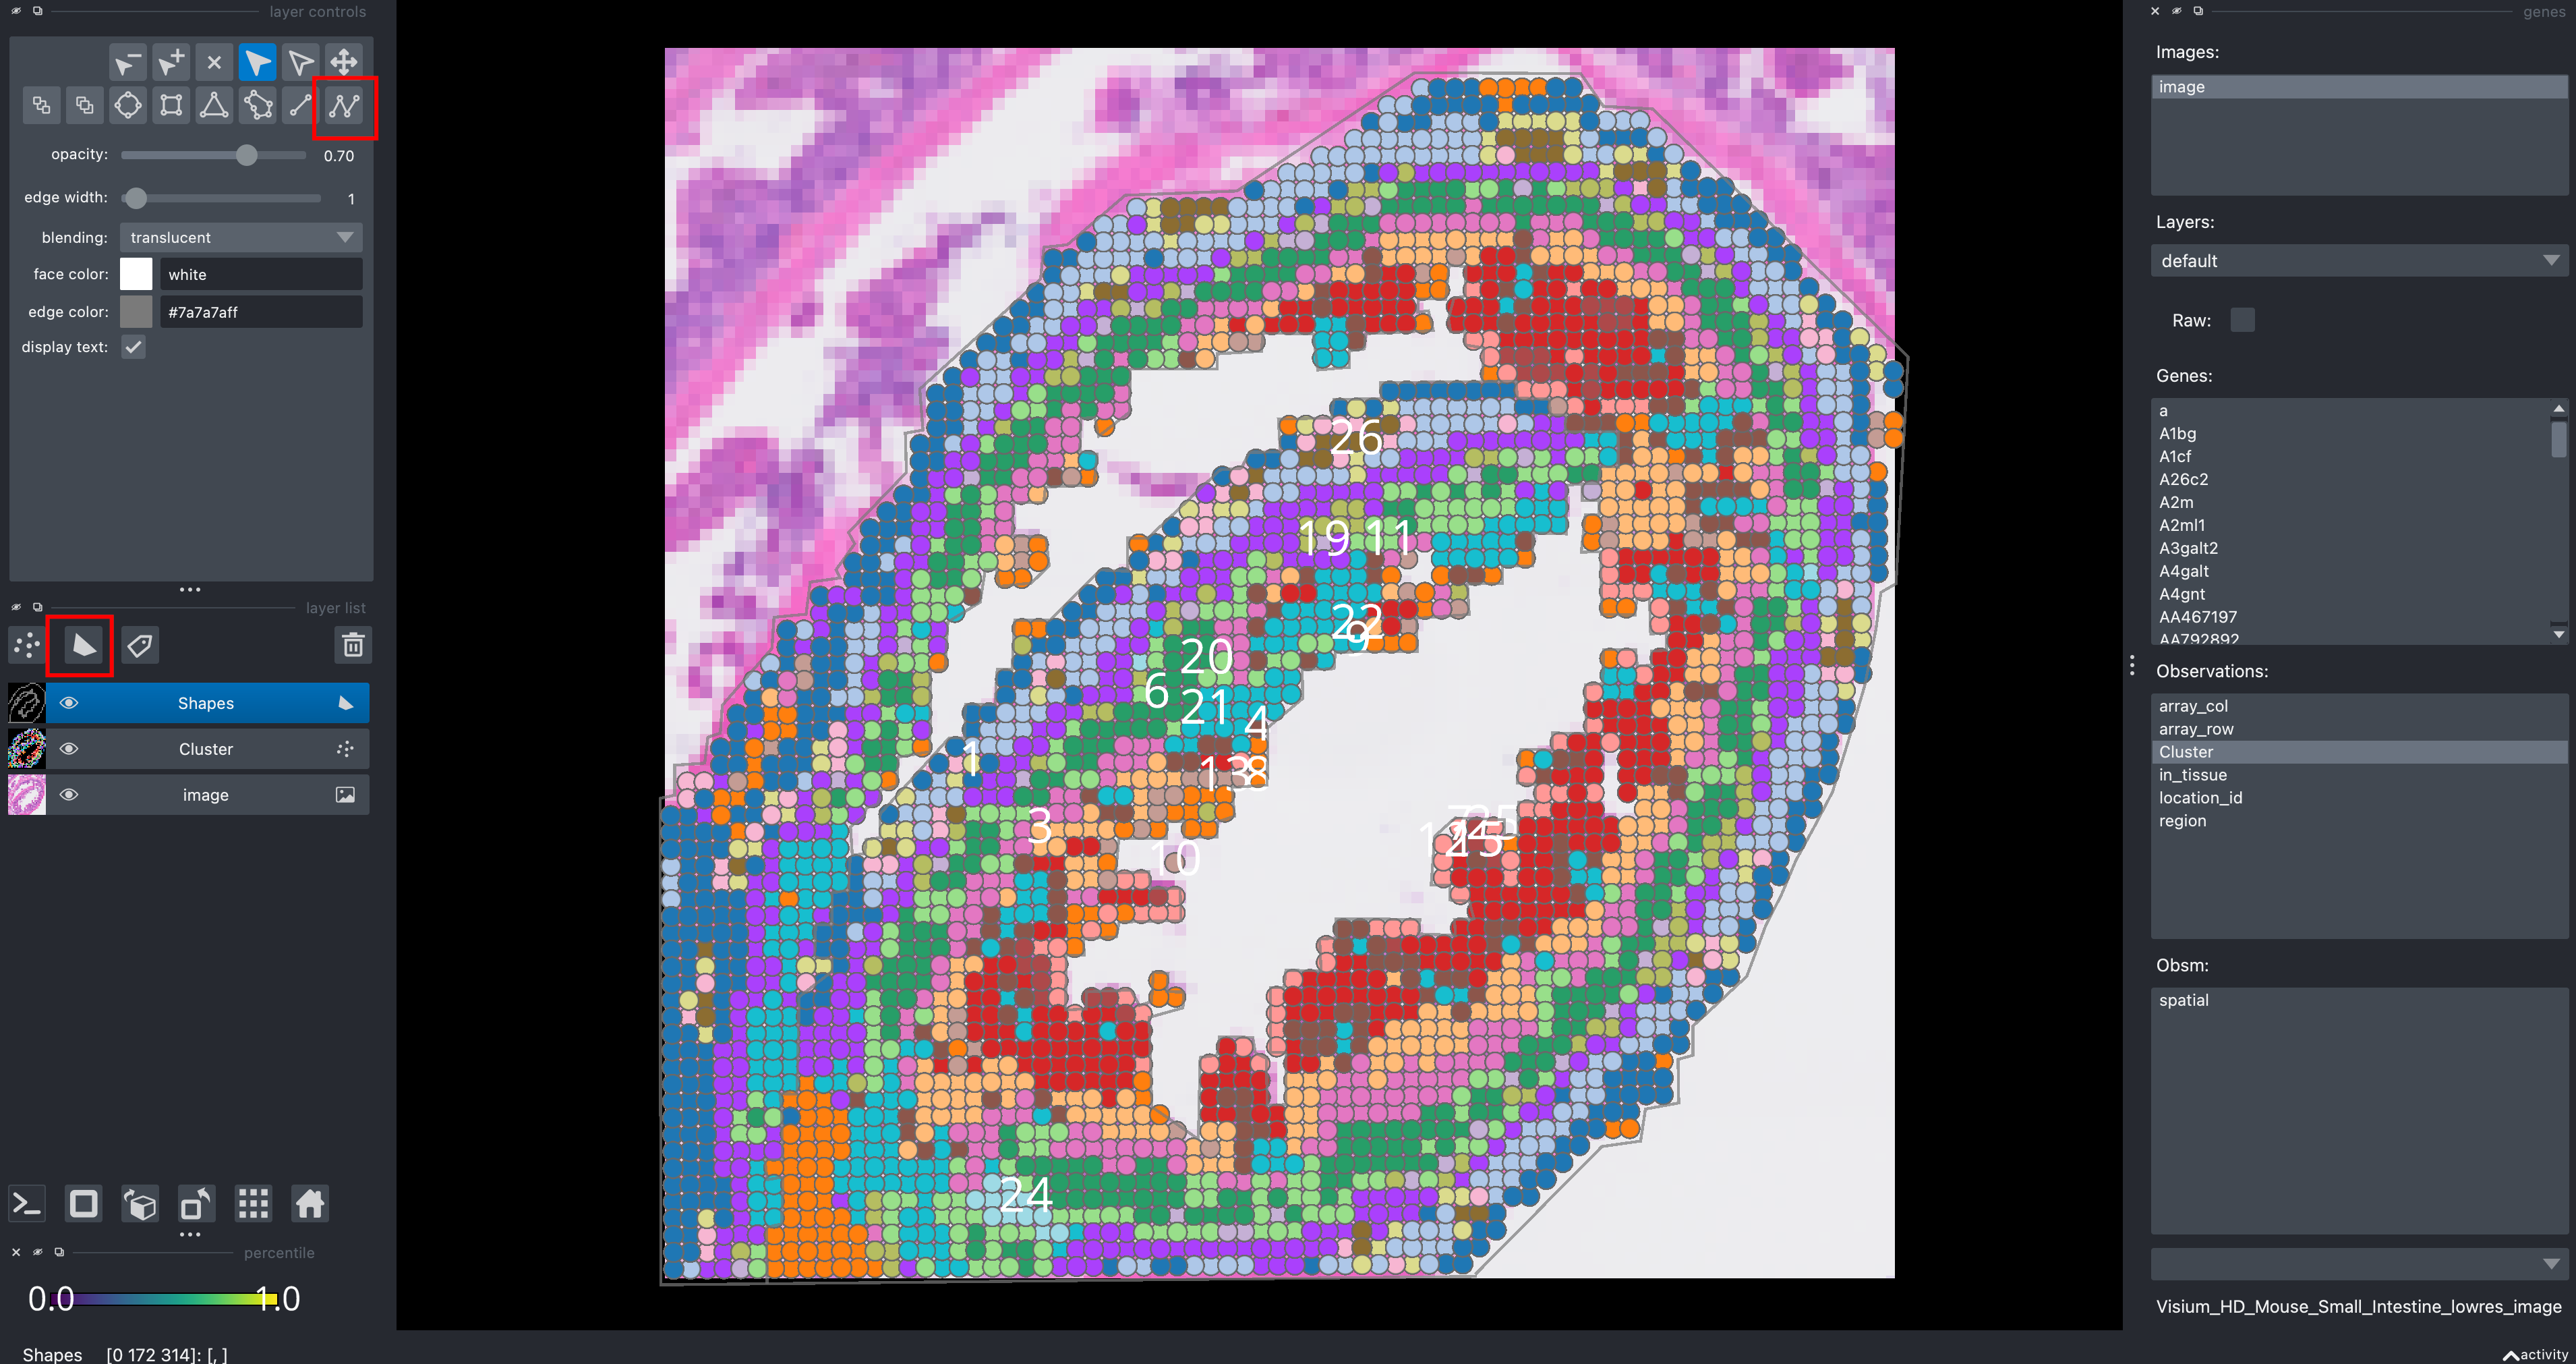
We can see a interface like this:
Click new shapes layer, and click Add path to outline the boundary of the barrier. Then you choose that layer and click File and Save selected layers to the folder, you will get a csv file for line segments of barrier.
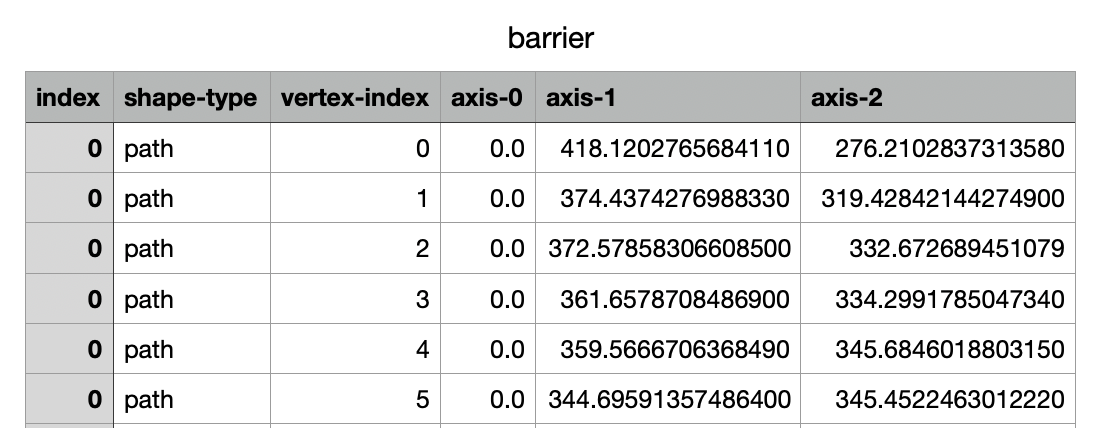
MetaChat provides a function mc.pp.load_barrier_segments to import this barrier information. The coordinate order in Napari may differ from that in Visium; you can define the order using coord_cols. The adata uses tissue_hires_scalef coordinates during import, while the images use tissue_lowres_scalef. Since we directly annotate barriers on the images, we should adjust the scale to align with the adata data.
dict_scale = adata.uns['spatial']['Visium_HD_Mouse_Small_Intestine_lowres_image']['scalefactors']
scale = dict_scale['tissue_hires_scalef']/dict_scale['tissue_lowres_scalef']
barrier_segs = mc.pp.load_barrier_segments("datasets/mouse_small_intestine/barrier.csv", coord_cols=("axis-2", "axis-1"), scale=scale)
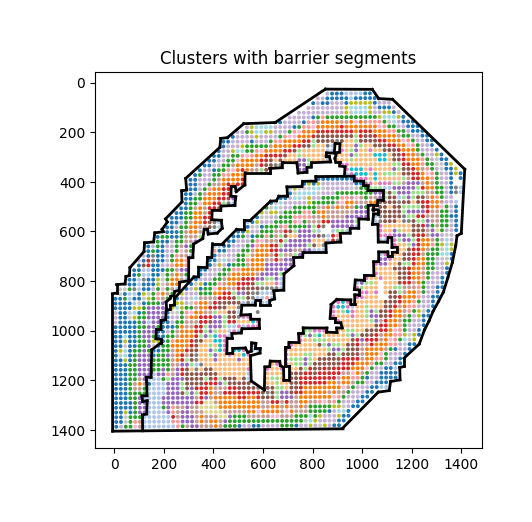
We can use simple visualization to check whether the barrier coordinates are correct.
# Check barriers
clusters = adata.obs["Cluster"] if "Cluster" in adata.obs else None
XY = np.asarray(adata.obsm["spatial"], float)

fig, ax = plt.subplots(figsize=(5,5))
cats = pd.Categorical(clusters)
ax.scatter(XY[:,0], XY[:,1], s=8, c=cats.codes, cmap="tab20", edgecolor="none")

for (a, b) in barrier_segs:
    x = [a[0], b[0]]
    y = [a[1], b[1]]
    ax.plot(x, y, lw=2, c="black")

ax.set_aspect("equal", adjustable="box")
ax.invert_yaxis()
ax.set_title("Clusters with barrier segments")
plt.show()
Then, this barrier_segs can be used in the function mc.pp.compute_costDistance of computing cost distance in optimal transport. Please see detailed application in the tutorial.