Estimating spatial metabolomics from spatial transcriptomics using MEBOCOST
Brief introduction
In this tutorial, we demonstrate how to estimate spatial metabolomics maps from spatial transcriptomics datasets using MEBOCOST [Zheng et.al, 2025]. These inferred metabolite fluxes can then be integrated into MetaChat to infer metabolic cell communication (MCC).
MEBOCOST infers whether a metabolite is active in a cell by calculating the average expression of its producing‐enzyme genes minus the average expression of its consuming-enzyme genes.
MEBOCOST can infer the activity of 591 metabolites with very fast computation. However, since the estimation is based on a simple summation of producing and consuming enzyme expression, the biological plausibility of the inferred metabolite levels should be interpreted with caution.
Installation
You can follow the guideline of installation from tutorials of MEBOCOST.
Create an independent environment
mamba create -n mebocost python=3.12
mamba activate mebocost
Download MEBOCOST
git clone https://github.com/kaifuchenlab/MEBOCOST.git
cd MEBOCOST
Install requirements:
pip install -r requirements.txt
python -m pip install .
Usage
# Importing packages
import os
import scanpy as sc
import pandas as pd
import anndata as ad
from mebocost import mebocost
# Setting your work directory
os.chdir("/home/project/metachat/other_packages/MEBOCOST/")
Here, we use an example dataset from https://support.10xgenomics.com/spatial-gene-expression/datasets, which also can be download from zenodo.
adata_RNA = sc.read("/home/project/metachat_packages/datasets/visium_10x_mouse_brain/adata_RNA.h5ad")
adata_RNA
AnnData object with n_obs × n_vars = 2702 × 32285
    obs: 'in_tissue', 'array_row', 'array_col'
    var: 'gene_ids', 'feature_types', 'genome'
    uns: 'spatial'
    obsm: 'spatial'
Create a mebocost object
mebo_obj = mebocost.create_obj(
    adata = adata_RNA,
    ## "Celltype" must be a column name of adata.obs table, otherwise, change it according to your data.
    group_col = 'in_tissue',
    condition_col = None,
    met_est = 'mebocost',
    # make sure mebocost.conf file in the same folder of this notebook, otherwise, provide a absolute path.
    config_path = '/home/project/metachat/other_packages/MEBOCOST/src/mebocost.conf',
    exp_mat=None,
    cell_ann=None,
    ## make sure you set the right species
    species='mouse',
    met_pred=None,
    met_enzyme=None,
    met_sensor=None,
    met_ann=None,
    scFEA_ann=None,
    compass_met_ann=None,
    compass_rxn_ann=None,
    cutoff_exp='auto', ## automated cutoff to exclude lowly ranked 25% sensors across all cells
    cutoff_met='auto', ## automated cutoff to exclude lowly ranked 25% metabolites across all cells
    cutoff_prop=0.15, ## at lease 10% of cells should be expressed the sensor or present the metabolite in the cell group (specified by group_col)
    sensor_type='All',
    thread=8
)
[October 19, 2025 16:56:40]: We get expression data with 32285 genes and 2702 cells.
[October 19, 2025 16:56:40]: Data Preparation Done in 0.0005 seconds
mebo_obj._load_config_()
mebo_obj.estimator()
[October 19, 2025 16:56:41]: Load config and read data based on given species [mouse].
[October 19, 2025 16:56:41]: Estimtate metabolite enzyme expression using mebocost
Get the estimated metabolite abundance.
met_mat = pd.DataFrame(mebo_obj.met_mat.toarray(),
                      index = mebo_obj.met_mat_indexer,
                      columns = mebo_obj.met_mat_columns)
Save to your path.
met_mat.to_csv("/home/project/metachat_packages/datasets/visium_10x_mouse_brain/mebocost/estimated_metabolite.csv", index=True, header=True)
Change back to MetaChat environment
# Importing packages
import os
import scanpy as sc
import pandas as pd
import anndata as ad
# Setting your work directory
os.chdir("/home/project/metachat_packages/")
import sys
sys.path.append("/home/project/metachat_packages/MetaChat-main")
import metachat_new as mc
adata_RNA = sc.read("datasets/visium_10x_mouse_brain/adata_RNA.h5ad")
adata_RNA
AnnData object with n_obs × n_vars = 2702 × 32285
    obs: 'in_tissue', 'array_row', 'array_col'
    var: 'gene_ids', 'feature_types', 'genome'
    uns: 'spatial'
    obsm: 'spatial'
adata_RNA.var_names_make_unique()
adata_RNA.raw = adata_RNA
sc.pp.normalize_total(adata_RNA, inplace=True, target_sum=1e5)
sc.pp.log1p(adata_RNA)
adata_META = mc.pp.generate_adata_met_mebocost('datasets/visium_10x_mouse_brain/mebocost/estimated_metabolite.csv')
adata_META
AnnData object with n_obs × n_vars = 2702 × 591
adata_combined = ad.concat([adata_RNA, adata_META], axis=1, join="outer")
adata_combined.obs = adata_RNA.obs.copy()
adata_combined.uns = adata_RNA.uns.copy()
adata_combined.obsm = adata_RNA.obsm.copy()
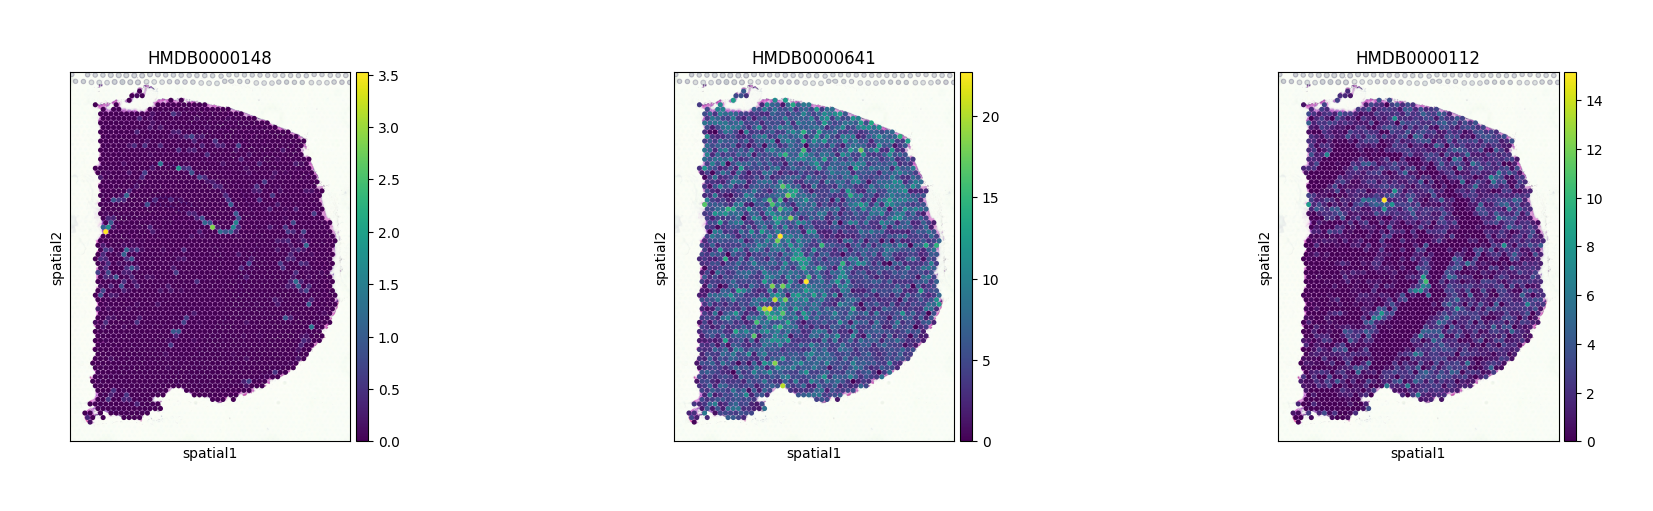
At this stage, we can visualize glutamate, glutamine, and GABA as examples, using their corresponding HMDB IDs.
sc.pl.spatial(adata_combined, color=["HMDB0000148", "HMDB0000641", "HMDB0000112"], size=1.5)